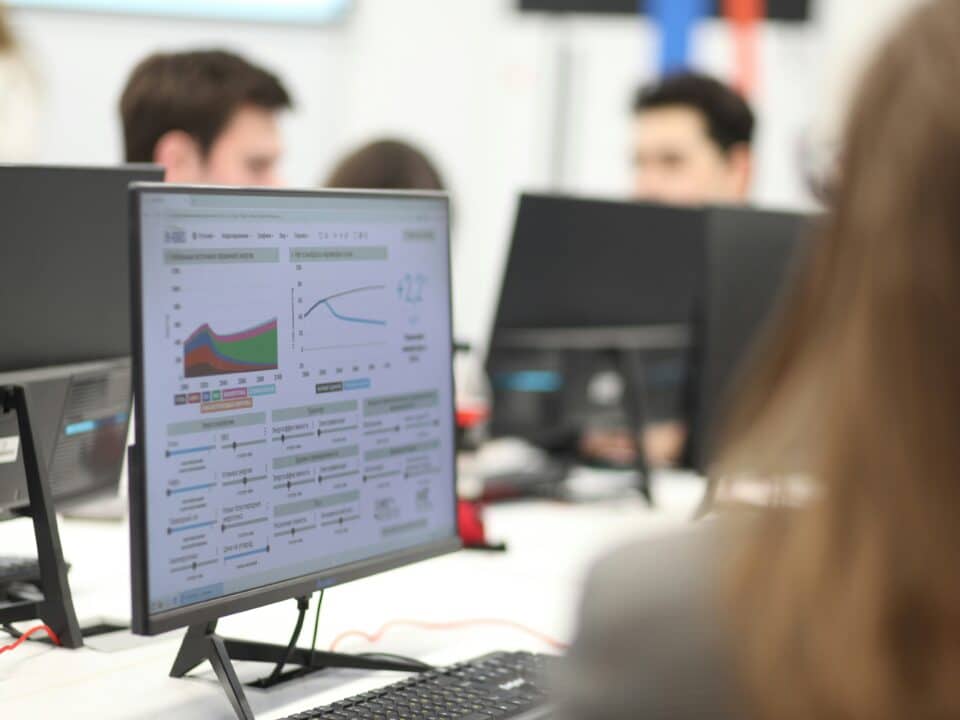
Sample dashboard: monitoring your logistics solution

How do you design your e-commerce packaging?
19 June 2025
3PL: Understanding outsourced logistics
21 July 2025
- 9 minutes

In an economic context marked by increasingly demanding customers, digitalization and complex supply chains, logistics management is becoming a strategic issue. To remain successful, companies need to be able to monitor their operations in real time, identify bottlenecks and act quickly. This is where the logistics dashboard comes in.
This management tool not only enables you to visualize key supply chain data, but also to structure a continuous improvement approach.
What is a logistics dashboard?
In a nutshell, a logistics dashboard is a synthetic visual tool for monitoring supply chain performance in real time. It centralizes the most relevant key performance indicators (KPIs), whether for warehousing, transport, order preparation or customer service.
It can be static (e.g. Excel) or dynamic (e.g. Power BI, Tableau), accessible to different hierarchical levels (operational, managerial, executive) and updated daily, weekly or monthly, for example.
Its main objectives:
- Improve visibility of operations
- Tracking performance
- Identify sticking points
- Optimizing processes
- Aligning operations with strategic objectives
Why use a logistics dashboard?
Visualize performance in real time
Firstly, logistics operations generate a vast amount of data. A dashboard aggregates this data in a readable way and translates it into exploitable key indicators. In this way, the dashboard facilitates overall understanding of logistics flows. Thanks to clear, well-presented indicators, managers can have an instant view of the state of the logistics chain.
Anticipating tensions and adjusting capacities
KPIs facilitate rapid diagnosis and decision-making, i.e., adjusting resources, adapting flows, reducing costs, etc. A good logistics dashboard includes forecasting data. Above all, it enables you to anticipate peaks in activity (sales, holidays, product launches) and better manage resources (personnel, carriers, packaging, etc.). By rapidly identifying deviations or cost overruns (stock-outs, late deliveries, high returns rates, etc.), the dashboard enables you to react quickly and adjust processes, which often translates into significant economic gains.
Continuous improvement and ROI
Regular monitoring of indicators also enables us to engage in a dynamic of continuous improvement. Efficient logistics are a key factor in customer satisfaction. Precise monitoring helps guarantee delivery times, preparation quality and better communication with customers.
Which KPIs to include?
- The choice of indicators is central. Here is a selection of relevant KPIs to include in a sample logistics dashboard, classified by category.
Operational performance: measuring day-to-day efficiency
The following KPIs can be used to assess the fluidity and efficiency of field operations. An example of an effective dashboard will highlight :
- Service rate: % of orders delivered on time and without error
- Average processing time: time from order receipt to dispatch
- Correct preparation rate: orders without item or quantity errors
- Productivity per picker: number of parcels/hour
This data enables us to manage our teams as closely as possible to the field, and to quickly identify any malfunctions likely to impact customer satisfaction.
Service quality: a loyalty-building factor
Beyond raw performance, quality as perceived by customers is crucial. A quality logistics dashboard must include indicators such as :
- Return rate: % of orders returned
- Customer complaint rate
- Average after-sales response time
A dashboard integrating these elements can reveal recurring problems (damaged products, picking errors, missed deadlines) and guide corrective action.
Logistics costs: maintaining financial control
- Logistics cost per order: fixed and variable costs per number of orders
- Average freight cost
- Non-quality rate: errors, losses, returns, after-sales rework
Inventory and procurement
The logistics dashboard must also provide a clear view of stock levels, stock rotation and the reliability of supply forecasts.
- Inventory turnover rate
- Out of stock
- Inventory accuracy: physical/theoretical stock comparison
- Average storage time
This data can be cross-referenced with sales data to fine-tune restocking, anticipate shortages and limit the immobilization of cash.
Environmental indicators
- Transported vacuum rate
- Total GHG emissions
- Low-emission delivery rates
- CO2 emissions per package
- Consumption of consumables (cardboard, silk sheet, tape, dunnage paper)
By tracking these indicators on a dashboard, for example, companies can implement concrete actions such as choosing eco-responsible carriers, reducing packaging or optimizing routes.
Example of a logistics dashboard
Here’s a sample dashboard structure for an e-commerce or retail company, using a tool like Power BI.
Executive Dashboard overview
- Daily / weekly / monthly prepared orders
- Overall service rate
- Ratio of packages delivered or made available/ packages in progress or returned
- Number of returns
- Volume shipped
- Unit logistics cost
- Country of destination
Order picking
- Average picking time
- Number of parcels prepared per hour / per operator
- Preparation errors
- Shipping delays
Transport and delivery
- Delivery performance (on-time delivery rate)
This can include the proportion of packages delivered or presented early, on time or out of time.
- Carrier delays
- Reasons affecting delivery times
- Delivery complaints
- CO2 emissions / km
- Breakdown of GHG emissions by segment/ type of transport/ Country
- Breakdown of parcel volumes delivered to home delivery/retail outlets
- Quality of recipient data (rate of incorrect, non-compliant, unusable postal addresses and cell phone numbers)
- Breakdown of delivery volumes by carrier and selected options
Section 4: Stock and supply
- Inventory by logistics warehouse
- Out of stock
- Turnover by product / category
- Future supply rules
Indicator glossary
The percentage of orders delivered on time and without error. It reflects the reliability of the logistics department.
Average processing time, i.e. the time elapsed between receipt of an order and its delivery or dispatch.
The frequency with which a stock is completely renewed over a given period. A high rate means good fluidity.
Number of units or packages prepared per hour or per operator.
The difference between theoretical (computerized) stock and actual physical stock in the warehouse.
The proportion of orders returned by customers, either voluntarily or due to errors.
The amount of unused volume in parcels or trucks, synonymous with logistical waste.
How do you design a logistics dashboard?
Involving end-users is essential. We recommend integrating feedback from field teams and customers to ensure the relevance of indicators. It’s important to choose the right tools – Power BI for large organizations, Google Data Studio for SMEs, or Excel for the first level. Automating data collection guarantees reliability and real-time updating. Limit the number of KPIs to avoid information overload. The best is to choose between 8 and 15 key indicators. It is also a good idea to set up thresholds and alerts to automatically identify anomalies.
An effective logistics dashboard does more than just report: it guides, anticipates and fuels operational excellence. By relying on reliable, up-to-date and well-presented data, companies can turn their logistical constraints into a competitive advantage. It’s time to turn your data into levers for action.
Frequently asked questions
Learn how to use a sample logistics dashboard
Indicators must be aligned with operational and strategic objectives. It is advisable to start with a limited number and refine them over time, depending on their relevance to decision-making.
Aggregating data from several carriers requires standardization of formats (API, flat files, EDI). The ideal solution is to use middleware or a TMS (Transport Management System) interfaced with a visualization tool such as Power BI. This makes it possible to unify indicators (lead times, incidents, CO₂ emissions...).
It's a good idea to create a tab or segment dedicated to the campaign, with temporary indicators: average lead time during peak periods, post-campaign return rate, order volume by channel, pressure on inventory, etc. This facilitates post-campaign assessment and preparation for future campaigns. This facilitates post-campaign assessment and the preparation of future campaigns.
A good dashboard isn't just for logisticians. The after-sales service department can draw on it for key information: non-conformity rates, delivery status, current delays, return peaks. This improves the responsiveness of responses to customers and fosters inter-departmental collaboration.
Some tools (Power BI, Tableau, Qlik) can integrate interactive geographical maps with delivery data. This makes it possible to pinpoint problem areas (regions behind schedule, address errors, underserved areas) and adapt solutions (change of carrier, rerouting, etc.).
We need to collect data on transport emissions, packaging consumption and the proportion of eco-responsible deliveries. This data can come from carriers, WMS or order management systems.
Indicator monitoring by the steering committee

Dokeraa is with you every day
at your steering committees, project committees and production committees

